


BRICS FX Forecast Special Report
( 12 min )
- Go back to blog home
- Latest
29 April 2021
Head of Market Strategy at Ebury Providing expert currency analysis so small and mid-sized businesses can effectively navigate international markets.
How has Covid-19 affected the BRICS countries? Read our latest Special FX Forecast report or download it here.
Brazilian Real (BRL)
The Brazilian real (BRL) remains one of the worst performing currencies in the world since the start of the COVID-19 pandemic. The currency lost around one-quarter of its value against the US dollar in the first four-and-a-half months of last year, falling to just shy of 6 to the US dollar in May 2020, its lowest ever level. By June last year, BRL had recovered almost half of these losses, although it has since sold-off again, bouncing around the 5.5 level (Figure 1). The real has been the worst performing major emerging market currency in the world since the start of last year.
Figure 1: USD/BRL (April ‘20 – April ‘21)
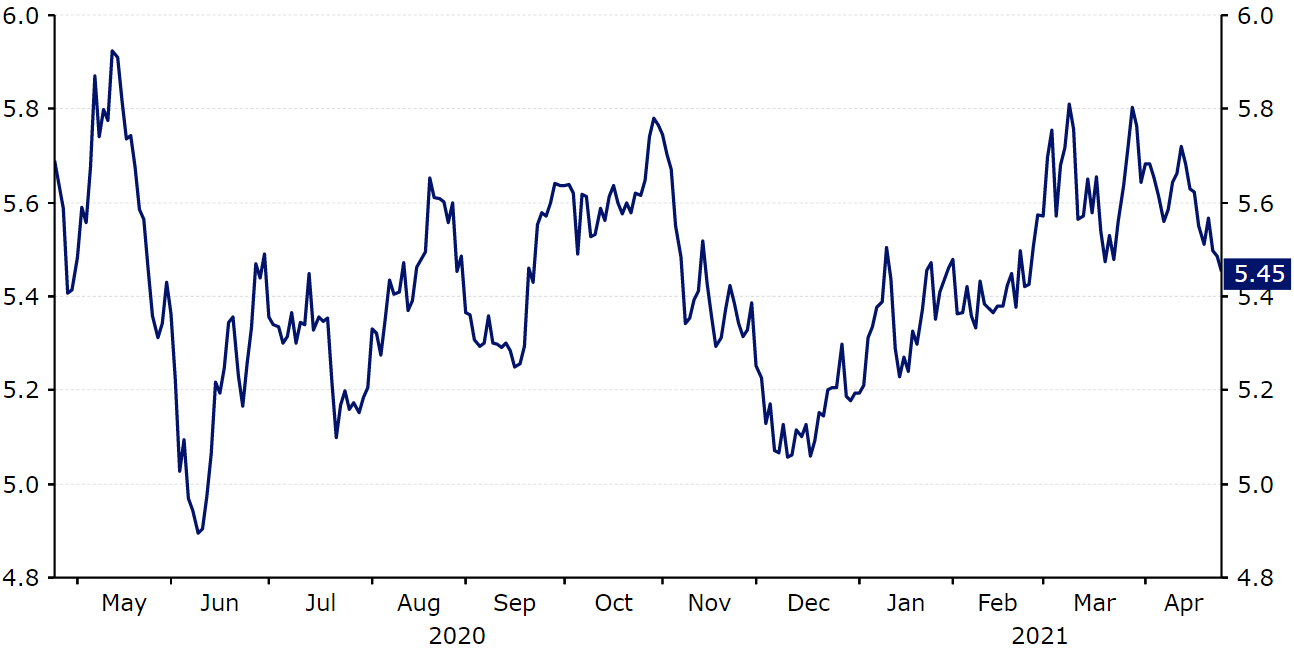
Source: Refinitiv Datastream Date: 27/04/2021
Ongoing criticism of authorities’ handling of the pandemic has significantly soured sentiment towards the real since the early stages of the crisis. Far-right President Jair Bolsonaro has adopted a troublesome approach to dealing with the pandemic. Bolsonaro has actively encouraged people to defy social distancing, ignore regional lockdown and partake in large gatherings. As a consequence, Brazil has racked up the second highest number of COVID-related deaths in the world, behind only the far more populous US, despite relatively limited levels of testing. Brazil now accounts for 12.5% of the world’s COVID-19 death toll, despite only making up 2.7% just of the population.
The latest wave of infection has been the worst so far, in large part due to the prevalence of the P.1 strain of the virus that was first identified in January. This variant is said to not only be twice as contagious as the original strain, but also more than 60% likely to reinfect people than other versions of the COVID-19 virus. Hospital admissions have surged in Brazil, with many intensive care units reportedly either at or close to full capacity. Bolsonaro has, however, continued to criticise regional state governors for enforcing lockdowns, with the president instead prioritising the health of the economy. Deaths caused by the virus surged to record highs above 4,000 a day in early-April (Figure 2), and have remained elevated ever since. Authorities in Brazil have also been rather slow to both approve and adminiterd the various COVID vaccines – so far only approximately 18 vaccine doses per 100 people have been administered in Brazil, not too far above the world average.
Figure 2: Brazil New COVID-19 Deaths (April ‘20 – April ‘21)
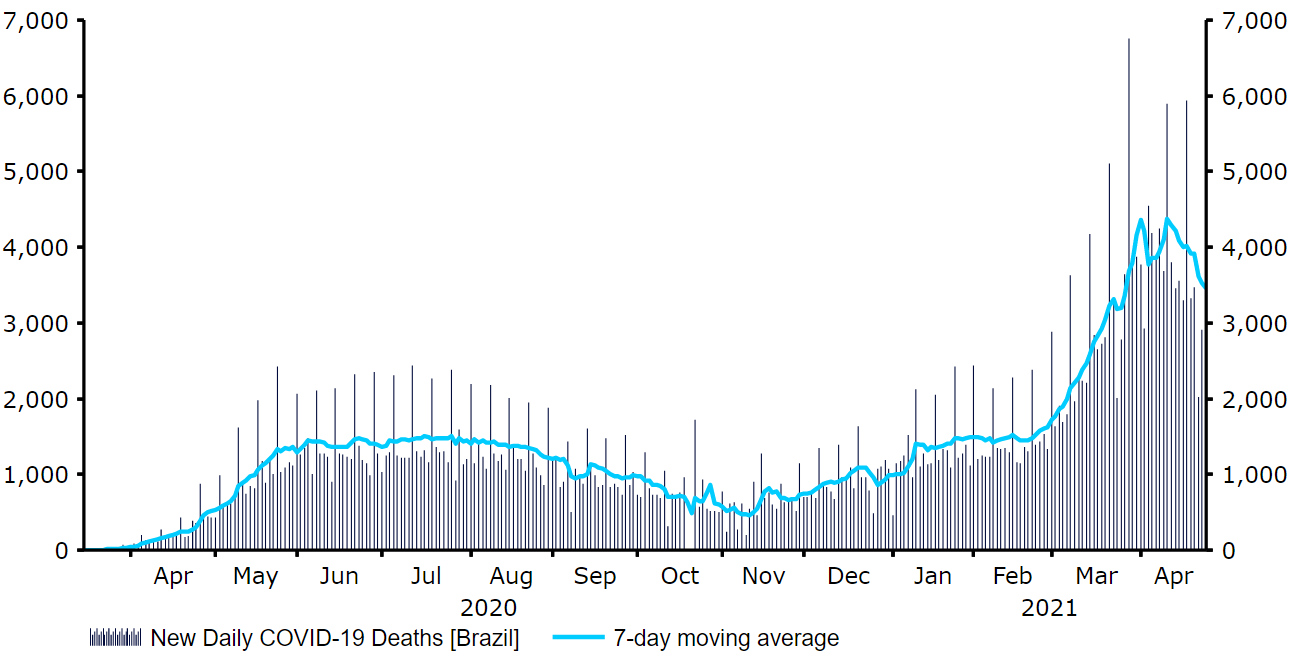
Source: Refinitiv Datastream Date: 27/04/2021
We do, however, think that the real has been spared even larger losses by the hawkish policy stance adopted by the Central Bank of Brazil. The central bank raised interest rates by a larger-than-expected 75 basis points to 2.75% in March, the first in six years, while also suggesting that a hike of the same magnitude was on the way at the bank’s May meeting. The decision to raise rates this early has been controversial, but policymakers have cited the recent increase in domestic inflation, which rose above 6% in March for the first time in more than four years.
The rate setting committee noted in its March communications ‘barring a significant change in inflation projections or the balance of risks facing the economy, the committee foresees continuing the process of partially winding down its monetary stimulus with another adjustment of the same magnitude [in May].’ The decision to engage in a tightening cycle is a bold one, given the current challenges to growth. Brazil’s economy has bounced back strongly following last year’s recession, registering positive growth of 7.7% and 3.2% QoQ in Q3 and Q4 respectively. The government is, however, coming under increasing pressure to enforce tougher lockdown restrictions. Heads of Brazil’s army, navy and airforce all resigned in opposition of Bolsonaro’s covid policies in March, with the president’s approval rating also plunging to around 30%.
Despite the clearly concerning pandemic situation in the country, we are encouraged by Brazil’s strong macroeconomic fundamentals. These should, in our view, allow BRL to recover most of its recent losses once the pandemic is brought under control:
1. Still high, albeit declining, FX reserves that equate to more than 15 months’ worth of import cover (Figure 3). This remains an ample level of ammunition for the Central Bank of Brazil to successfully intervene in the market in order to reverse the currency’s sell-off. The central bank has been increasingly active in the FX market in recent weeks, selling around $5.6 billion in the spot FX market and $6 billion in the FX swaps market in the first two-and-a-half months of the year alone. We expect this proactivity to continue in the near-term.
Figure 3: Brazil FX Reserves (2000 – 2021)
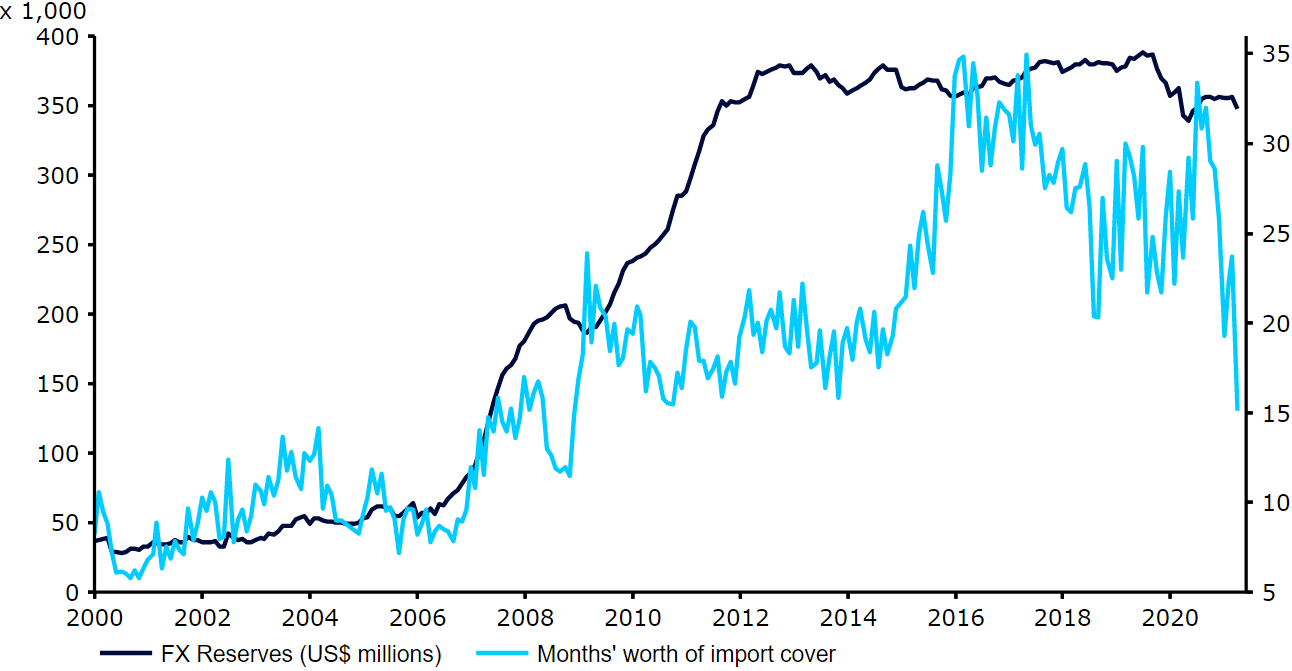
Source: Refinitiv Datastream Date: 27/04/2021
2. A manageable current account deficit that remains comfortably financed by foreign direct investment (FDI). This deficit decreased to 0.7% in 2020 from 2.7% in 2019.
An increase in Brazil’s external debt since the start of the COVID-19 pandemic to relatively high levels is a slight cause for concern, although as a percentage of GDP debt eased in the second half of last year to 37.2% of GDP. The recent sharp depreciation in BRL does, however, increase the real value of the debt payments.
Given the above supportive factors, and our view that the currency is very cheap at current levels, we do not think that a continued sell-off in the real at the rate witnessed since the onset of the crisis is likely in the long-term. We are instead continuing to pencil in a recovery for the currency against the dollar through to the end of 2021, and think that Brazil’s solid macroeconomic fundamentals should allow the currency to successfully bounce back once the worst of the crisis is over. This view is reinforced by the hawkish policy stance adopted by the Central Bank of Brazil, which looks likely to continue raising rates in 2021.
That being said, we are revising our near-term forecasts slightly higher in acknowledgment of the worsening pandemic situation in Brazil in recent weeks.
Russian Ruble (RUB)
The Russian ruble (RUB) suffered from one of the most violent sell-offs of all the emerging market currencies at the beginning of the COVID-19 pandemic in March 2020.
The currency collapsed to just shy of 2016’s record low versus the US dollar early-last year. Since then, the ruble has experienced relatively mixed fortunes. It recovered around half of its losses through to June, before selling off again to around its pandemic lows in November. In the past five months, RUB rebounded in line with the increase in global oil prices and improving risk sentiment, although it has come under pressure from ongoing geopolitical tensions. The currency has been one of the worst performers in the EM universe since the start of last year, behind only the Turkish lira (TRY) and Brazilian real (BRL).
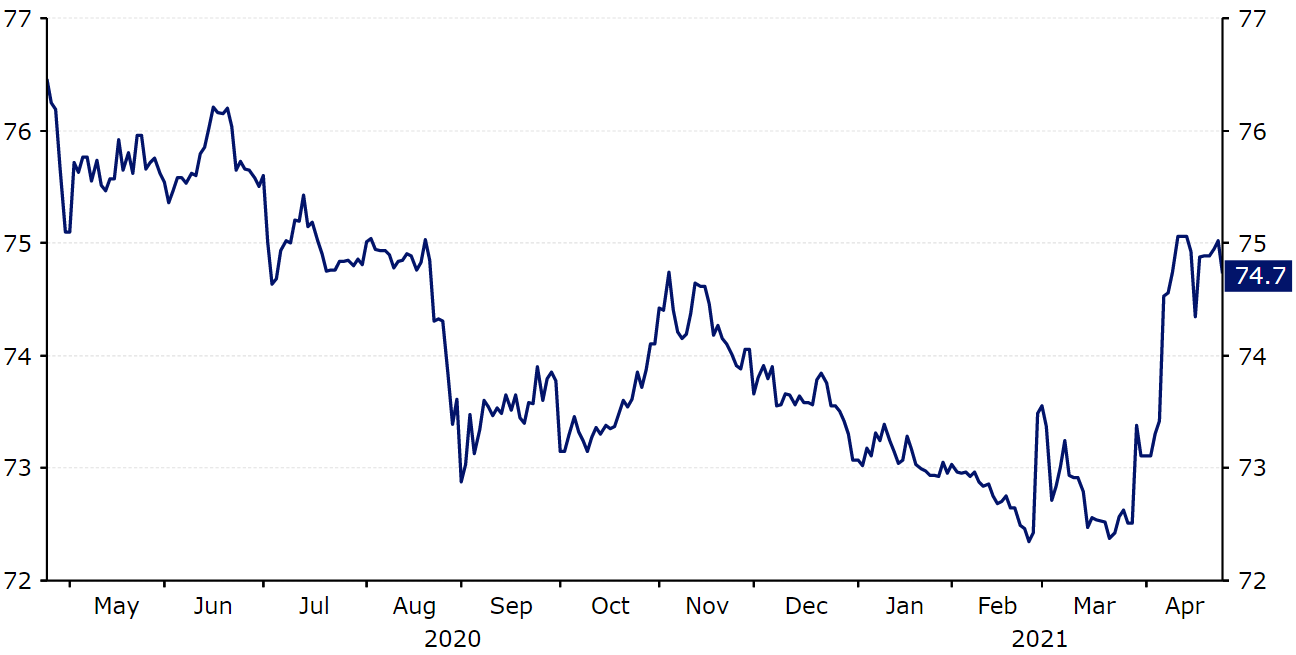
Figure 4: EUR/RUB (April ‘20 – April ‘21)
Source: Refinitiv Datastream Date: 27/04/2021
We attribute much of the extent of the sell-off in the ruble last year to the collapse in global oil prices. Russia’s economy remains highly dependent on global commodity prices, since oil and gas exports account for almost two-thirds of the country’s overall export revenue and one-third of its GDP. Global Brent crude oil prices tumbled to lows of below $20 a barrel during the second quarter of last year, although have since rebounded to above $60 a barrel as investors bet on a swift recovery in global demand for commodities. The correlation between oil prices and the ruble has weakened recently, although we expect this to reassert itself in the coming months, which may support the currency in the immediate-term.
Figure 5: RUB/USD vs. Brent Crude Oil prices (2016 – 2021)
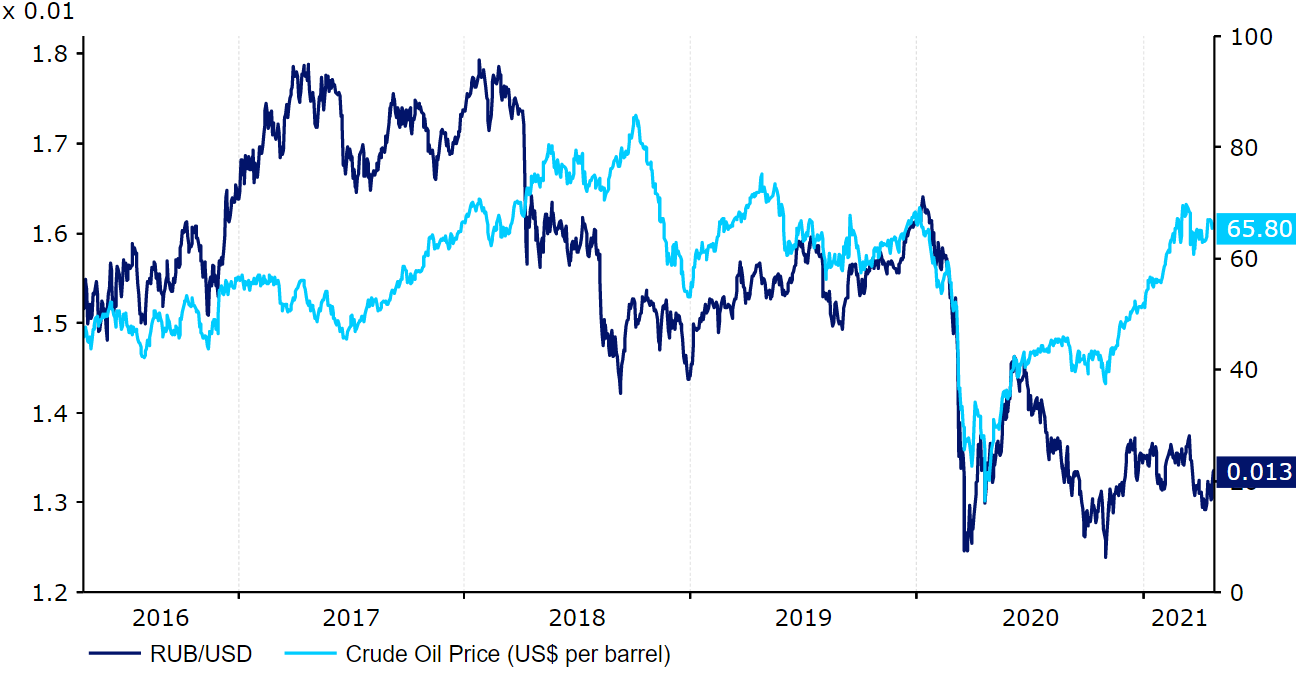
Source: Refinitiv Datastream Date: 27/04/2021
Russia’s official COVID-19 death toll of approximately 740 per 1 million people is relatively low, but is reportedly considerably understated given the significantly higher excess mortality numbers since the start of the pandemic. Excess deaths in Russia last year alone exceeded 300,000, around five times the official virus death tally for 2020. Caseloads of the virus have surged during the country’s second wave of infection, which began around September time. Daily deaths have eased in the past few weeks, although have continued to come in around the 400-550 range since mid-November. This has been in part a consequence of the much less stringent virus restrictions imposed in Russia relative to most other nations. There has been no full national lockdown since the spring of 2020, with authorities instead largely prioritising a reopening of the economy. The country’s COVID-19 Government Response Stringency Index, courtesy of Oxford University, has barely exceeded the level of 50 since the start of September (Figure 6).
Figure 6: Russia COVID-19 Government Response Stringency Index (Jan ‘20 – April ‘21)
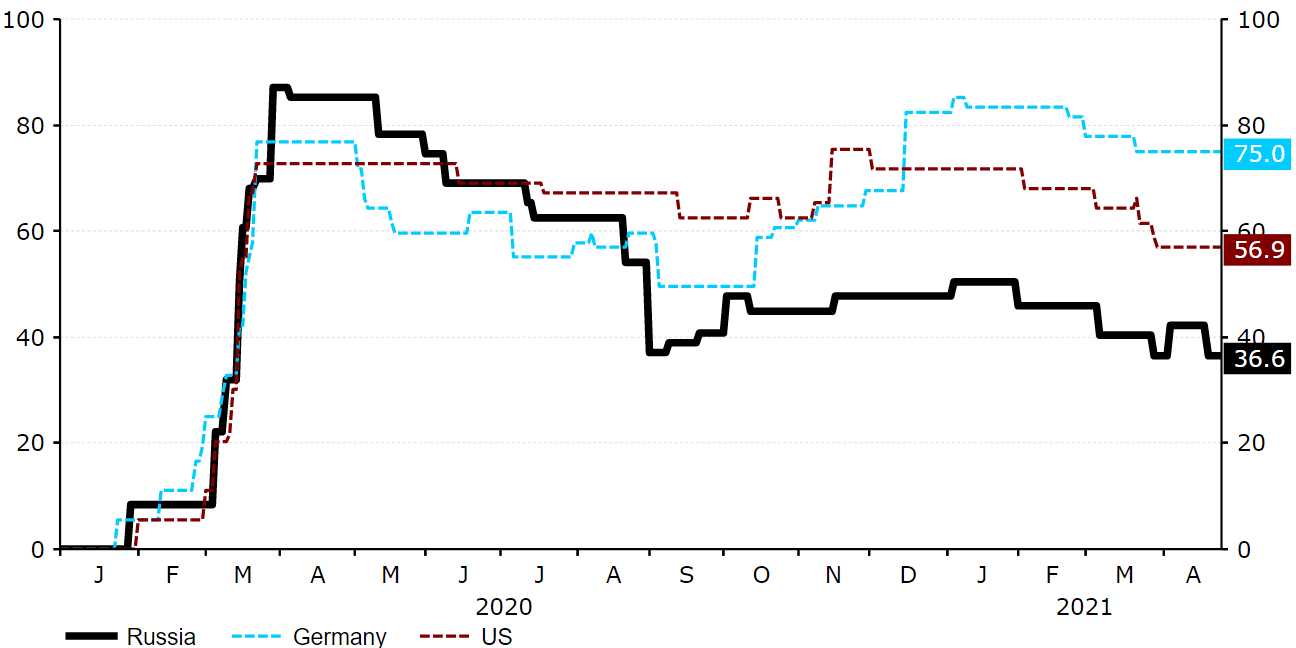
Source: Refinitiv Datastream Date: 27/04/2021
Mass vaccinations have, at least, begun in Russia using the Sputnik V vaccine. While the use of a domestically produced vaccine may give the country an advantage over some of its regional peers, the pace of vaccinations has so far been rather slow. Only around 12 doses per 100 people have so far been administered, which is roughly in line with the world average. A big stumbling block towards reaching herd immunity through vaccinations is likely to be the low vaccine uptake levels among Russia’s population. According to the Moscow Times, 60% of the country’s population are reluctant to receive the vaccine, which is a considerably higher hesitancy level than witnessed almost anywhere else.
The relatively less strict virus restrictions imposed in Russia have, at least, allowed the country’s economy to get back on its feet at a faster pace than originally anticipated. The economy contracted by a smaller-than-expected 3.1% year-on-year in 2020, with early data for this year suggesting that the recovery is going reasonably well. The composite PMI, for instance, is now back above the level of 50 that denotes expansion, having risen to a seven-month high 54.6 in March. So far rather modest fiscal support from the Russian government, which only equated to approximately 3.5% of GDP in 2020, suggests that there is also room for greater fiscal expansion in 2021, which would likely further support the recovery.
Of all the BRICS economies, we think that Russia has the strongest macroeconomic fundamentals. The ruble should be well placed to recover its pandemic losses once vaccines are distributed to a greater share of the global population. The Central Bank of Russia has accumulated a massive hoard of foreign exchange reserves down the years, which now amount to the equivalent of 30 months’ worth of import cover (Figure 7). This war chest should allow regular intervention in the market in order to protect the ruble, if needed. Russia’s current account balance is comfortably in positive territory, albeit the surplus declined in 2020. Russia is also far less reliant on external financing than many of its peers.
Figure 7: Russia FX Reserves (2000 – 2021)
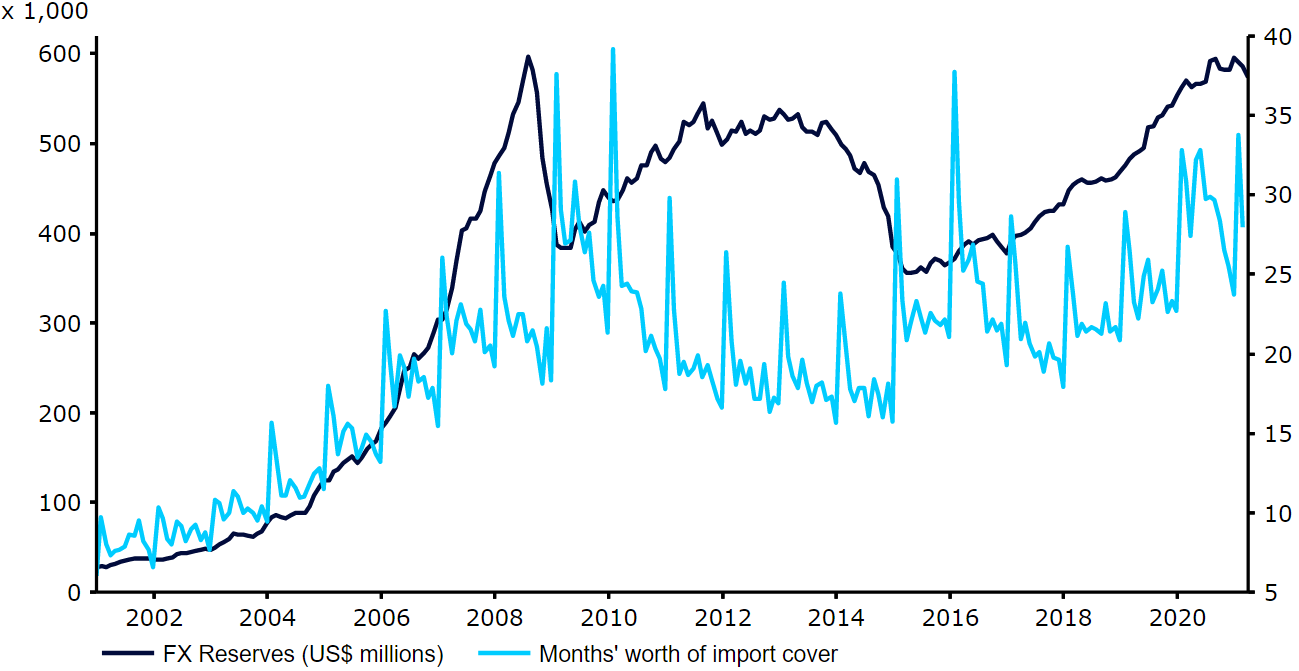
Source: Refinitiv Datastream Date: 27/04/2021
Moreover, Russia now offers significant carry following the recent interest rate hike from the Central Bank of Russia, the first change in rates since July 2020. Rates were raised by 25 basis points to 4.5% at the bank’s March meeting, a U-turn on the rather dovish message from February, with another 50 basis point hike announced in April. Commentary out of the two most recent meetings has also been hawkish. Governor Elvira Nabiullina noted that the economy would return to its pre-pandemic size before the end of 2021, inflationary pressure had increased and that rates were on a path towards neutral policy levels between 5-6%. We believe that this rhetoric signals that another hike is on the way at the June policy meeting.
We remain bullish towards the Russian ruble. The scope for a move higher in oil prices once global demand picks up should help support the currency, in our view, while Russia’s solid macroeconomic fundamentals will likely ensure that Russia remains an attractive proposition to foreign investors. The hawkish stance adopted by the Central Bank of Russia should also widen the interest rate differentials between Russia and most other major central banks over our forecast horizon. The recent sanctions announced by the Biden Administration are a risk, but we believe that these will have a limited impact on the currency, as has been the case in the past. We forecast gains for the ruble against both the euro and the US dollar between now and the end of 2022.
A downside risk to our forecast would be that Russia is one of the emerging market countries that carries non-negligible political risk. This has been evident on multiple occasions in recent months, notably the poisoning and jailing of opposition leader Alexei Navalny, tensions with the US over the Nord Stream 2 gas pipeline, cyberattacks and other matters resulting in sanctions, and the recent Russian buildup of troops on the Ukrainian border. These tensions have slightly clouded our view regarding the ruble and suggest that there’s now an enhanced internal risk premium that the ruble may have trouble shaking-off even after the pandemic situation stabilises.
Indian Rupee (INR)
The Indian rupee (INR) has continued to rebound gradually following the lows that it hit in the immediate aftermath of the COVID-19 outbreak.
INR fell to record lows in April 2020 as investors fled higher risk investments in favour of safe-havens. The currency emerged from the rout roughly in the middle of the EM performance tracker, spared severe losses due to FX intervention from the Reserve Bank of India (RBI). Since the peak of the downturn, the recovery in the rupee has been unspectacular (Figure 8), and the currency has actually sold-off again since late-March following a surge in new virus cases in India. This ensures that the rupee has been one of the worst performers in Asia in the past year.
Figure 8: USD/INR (April ‘20 – April ‘21)
Source: Refinitiv Datastream Date: 27/04/2021
We attribute both the relatively contained initial sell-off and subsequent shallower rebound in the rupee to intervention efforts of the RBI on both sides of the market. The central bank is believed to have conducted one of the largest interventions in its history in the six-week period during the height of the market panic in March and April last year, selling approximately $10 billion worth of reserves in an attempt to support the rupee. Since then, the RBI has returned to accumulating US dollar holdings to limit INR appreciation and support competitiveness. Foreign exchange reserves at the central bank increased to a record $542 billion in January (19% of GDP), a jump of 24% over a one-year period.
Figure 9: India FX Reserves (2000 – 2021)
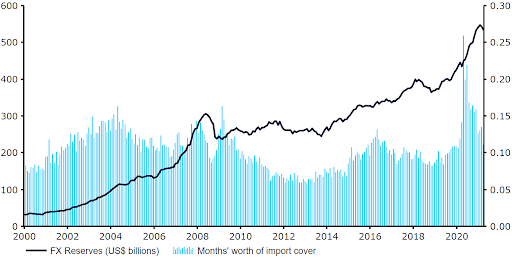
Source: Refinitiv Datastream Date: 27/04/2021
We think that intervention will continue in 2021 as policymakers attempt to weaken the currency in nominal effective exchange rate (NEER) terms. RBI Governor Shaktikanta Das indicated as much following the bank’s January meeting, noting that ‘to mitigate global spillovers, emerging markets like India have no recourse but to build their own forex reserve buffers, even though at the cost of being included in the currency manipulators list’. These interventions should, we believe, cap gains for the rupee during a year that we think will see broad gains for most emerging market currencies.
Up until very recently, we had not seen too much impact on the rupee from investors’ perception of the spread of the COVID-19 pandemic in India. In absolute terms, India has registered the second largest number of virus cases in the world, behind only the US. As a percentage of the total population both caseloads (12,500 per 1 million people) and deaths (140 per 1M) have, however, been relatively low, even relative to those countries that have conducted similar levels of testing (200,000 per 1M). The initial suppression in cases can be partly attributed to the ultra-strict restrictions that were enforced at the start of the crisis. An increase in the country’s government response stringency index to the maximum level of 100 between late-March and April suggests that these measures were indeed the harshest in the world. New cases and deaths have, however, sky-rocketed during the latest wave of infection, which has finally filtered its way through to a weaker rupee during a time when almost every other EM currency has posted gains versus the US dollar.
Figure 10: India New COVID-19 Cases (March ‘20 – April ‘21)
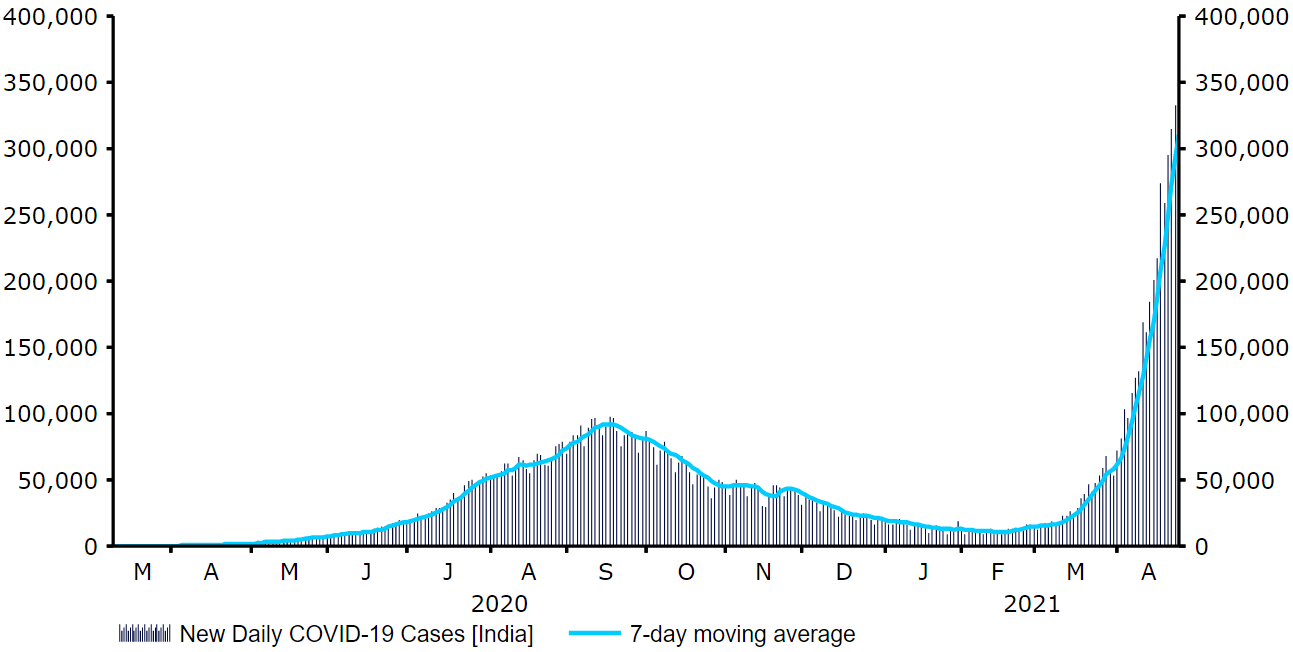
Source: Refinitiv Datastream Date: 27/04/2021
As we noted in our last update, indicators of economic activity in the immediate aftermath of the crisis collapsed, notably a drop in the country’s composite PMI to just 7.2 in April. Activity tanked by an unfathomable 25.9% quarter-on-quarter in Q2 2020, among the largest downturns in the world. Rebounds of 23.7% and 7.9% in the third and fourth quarters respectively have returned activity back towards more normal levels, with GDP ending Q4 around 0.4% higher year-on-year. The growth-focused budget unveiled by the Indian government at the beginning of the year is, however, a positive development for the outlook. A much larger-than-expected increase in the 20-21 fiscal deficit target to 9.5% of GDP, followed by a very gradual decline to 4.5% over five years, indicates a policy shift away from fiscal consolidation and towards one that is more growth-oriented.
Despite the underperformance of the Indian economy, we think investor confidence in the rupee should be well supported by India’s fundamentals. The recent accumulation of FX reserves means they are now more than sufficient at around 13.5 months’ worth of import cover. This should provide enough ammunition for the central bank to intervene in order to protect the currency, should sentiment take a turn for the worse. Below average oil prices since the start of the crisis has also been a positive for the country’s balance of trade and current account, given that India is a net importer of the commodity. India’s current account deficit remained close to flat at less than 1% of GDP in 2020, which is an encouraging sign.
Overall, we have a moderately positive view on the Indian rupee. On the one hand, the country’s economy has been one of the hardest hit by the strict lockdowns, with what is expected to be a very slow vaccine rollout unlikely to allow for a significant unwinding of measures in India in the near-term – particularly given the latest explosion in domestic virus cases. On the other, India continues to boast solid fundamentals that are among the strongest in the region. Continued FX intervention from the RBI, which now appears to have tightened its leish on the currency, should also keep the rupee within a narrower range than many of its peers. We are, therefore, forecasting a largely flat INR versus the US dollar over our forecast horizon around current levels.
Chinese Yuan (CNY)
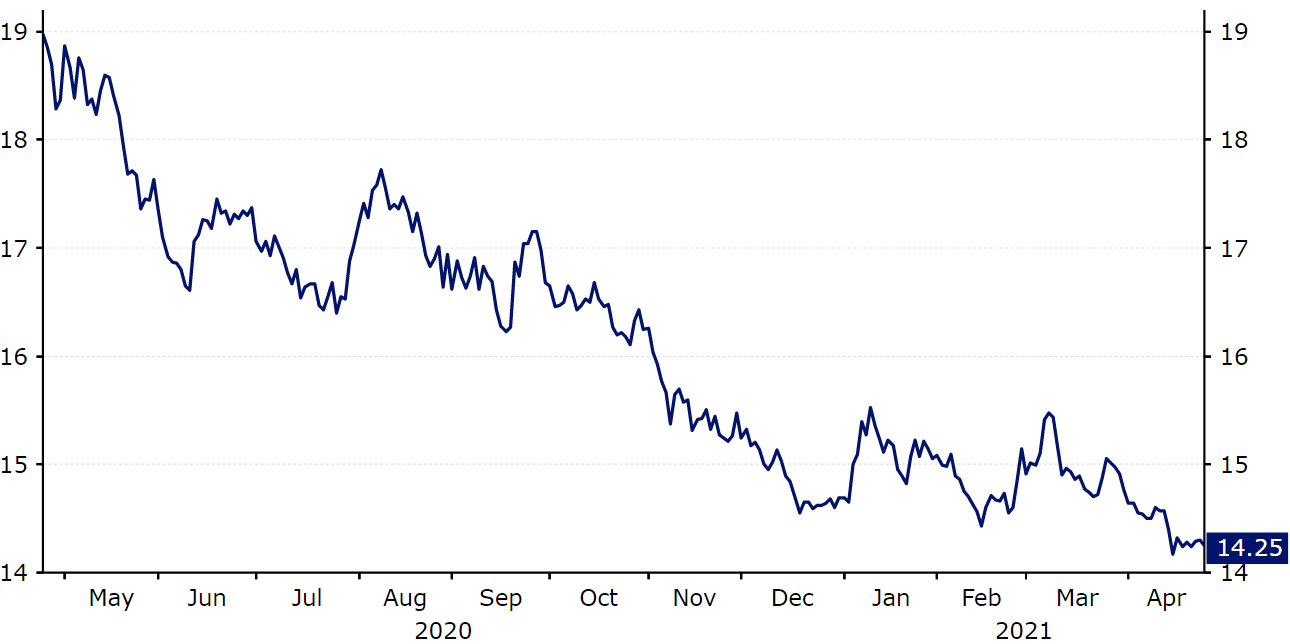
The Chinese yuan (CNY) has been one of the most resilient emerging market currencies in the world since the outbreak of the COVID-19 pandemic in the first quarter of 2020, to the point where it is not outlandish to consider it the newest inductee to the G10 club.
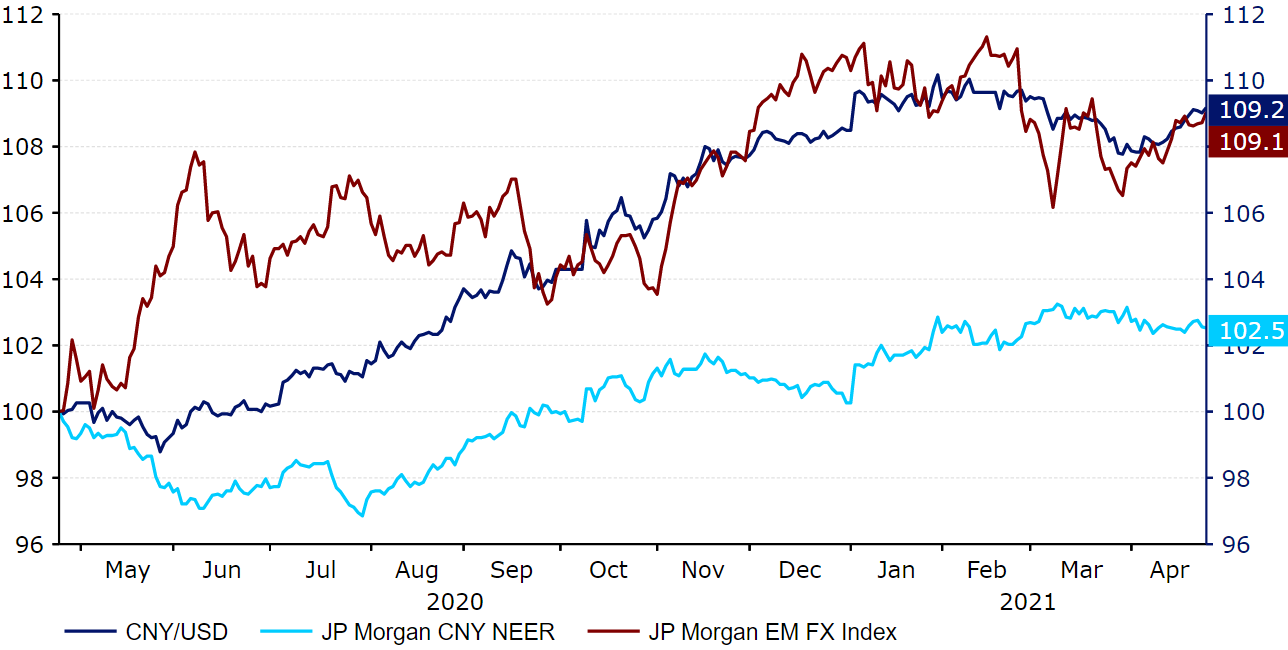
In line with the sharp move lower in risk assets, the yuan fell against the dollar in the first few months of last year. Since late-May the currency has, however, bounced back sharply, rallying below the 6.5 level to its strongest position since June 2018 in January (Figure 11). CNY has outperformed every other major emerging market currency since early-2020.
Figure 11: CNY/USD vs. JP Morgan EM FX Index (April ‘20 – April ‘21)
We think that much of the outperformance in the yuan has been due to the ability of authorities in China to control the spread of the COVID-19 virus. The country imposed strict restrictions as early as January 2020, registering a peak in cases soon afterwards. The 7-day average of new cases has remained below 100 since mid-March, only crossing this level in mid-January this year. As a percentage of the population, China has registered only 63 cases per 1 million people, significantly less than almost every other country in the world. This number is strikingly low compared to the US (99,000 per 1M), the UK (65,000 per 1M), and Germany (39,000 per 1M), but also the similarly populated India (12,500 per 1M).
While China has historically intervened in the FX market, it appears that the moves that we have witnessed since the beginning of the crisis have reflected market sentiment. The PBoC’s effort to closely manage the currency and ensure no more than a 2% daily deviation in the exchange rate means that the currency remains one of the least volatile EM currencies. The PBoC has pledged to keep the currency stable against the CFETS RMB index since early-2018. This basket of currencies has been periodically altered to reflect shifts in China’s international trade relationships. The most recent alteration in the basket has been the decreasing share of the US dollar (down from 26.4% in 2015 to 18.8% in 2021). The second-largest weight is assigned to the euro (18.15%), with the remaining two-thirds composed of an additional twenty-two other currencies. This index has risen by almost 6% since the beginning of 2020 (Figure 12), a larger move than that witnessed in the major EM indices.
Figure 12: RMB CFETS Index (2016 – 2021)
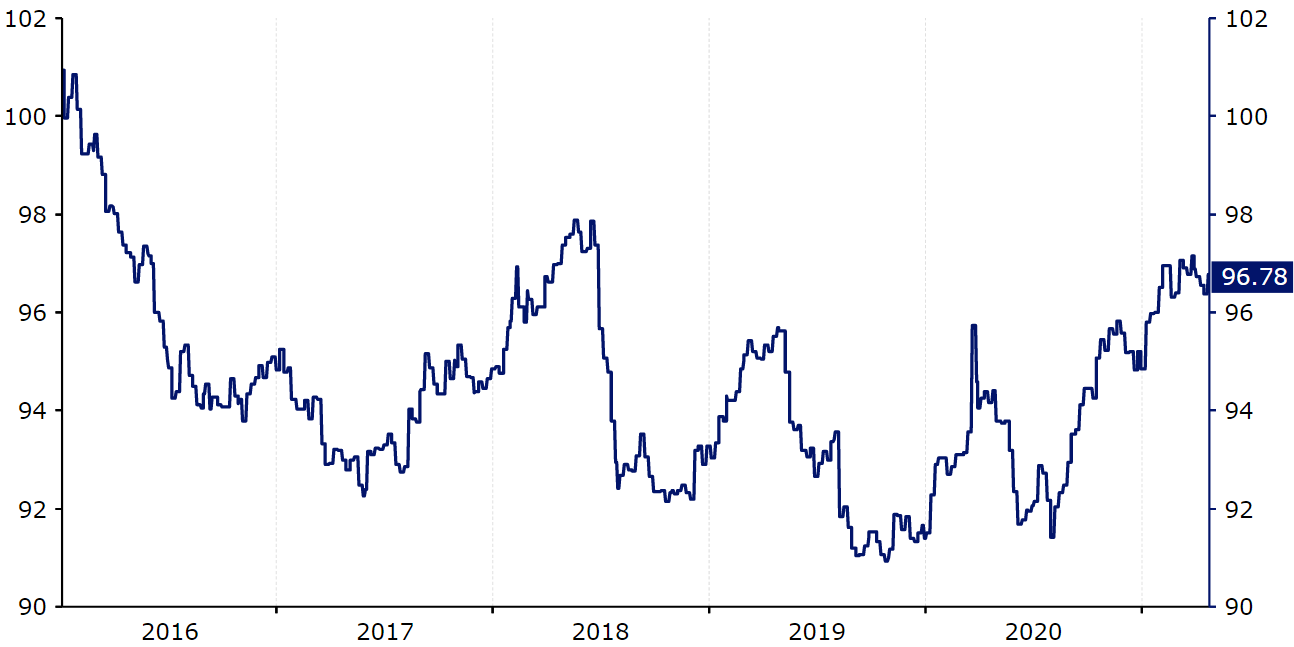
Source: Refinitiv Datastream Date: 27/04/2021
One of the main factors driving yuan strength in 2020 was the divergence in economic performance between China and almost every other country in the world. The ability of Chinese authorities to suppress caseloads and enforce more localised restrictions have proved to be less harmful to the country’s economy, which expanded by 3.1% quarter-on-quarter in Q3 2020 and by a further 3.2% in the fourth quarter. China’s economy suffered its worst performance since 1976 last year, although growth of 2.3% in 2020 was better-than-expected, with China one of the only major nations to experience growth last year.
Figure 13: GDP Growth Rate [China vs. US & Eurozone] (2020)
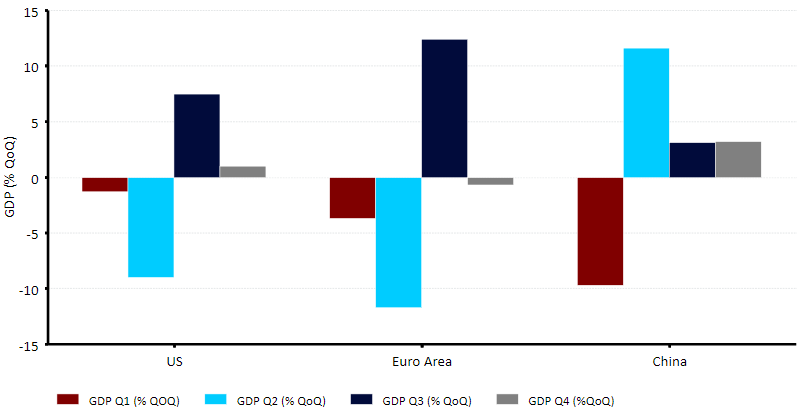
Source: Refinitiv Datastream Date: 27/04/2021
China’s economy has continued to perform well, despite an increase in cases leading to the recent reimposition of slightly stricter measures. Retail sales have rebounded strongly since the peak of the crisis, when they contracted by more than 20%, and have remained in positive territory since August in year-on-year terms. Industrial production has bounced back, reaching growth of more than 30% year-on-year in the first two months of 2021. Both the private and official PMIs also still remain comfortably in expansion territory (Figure 14).
Figure 14: China PMIs (2017 – 2021)
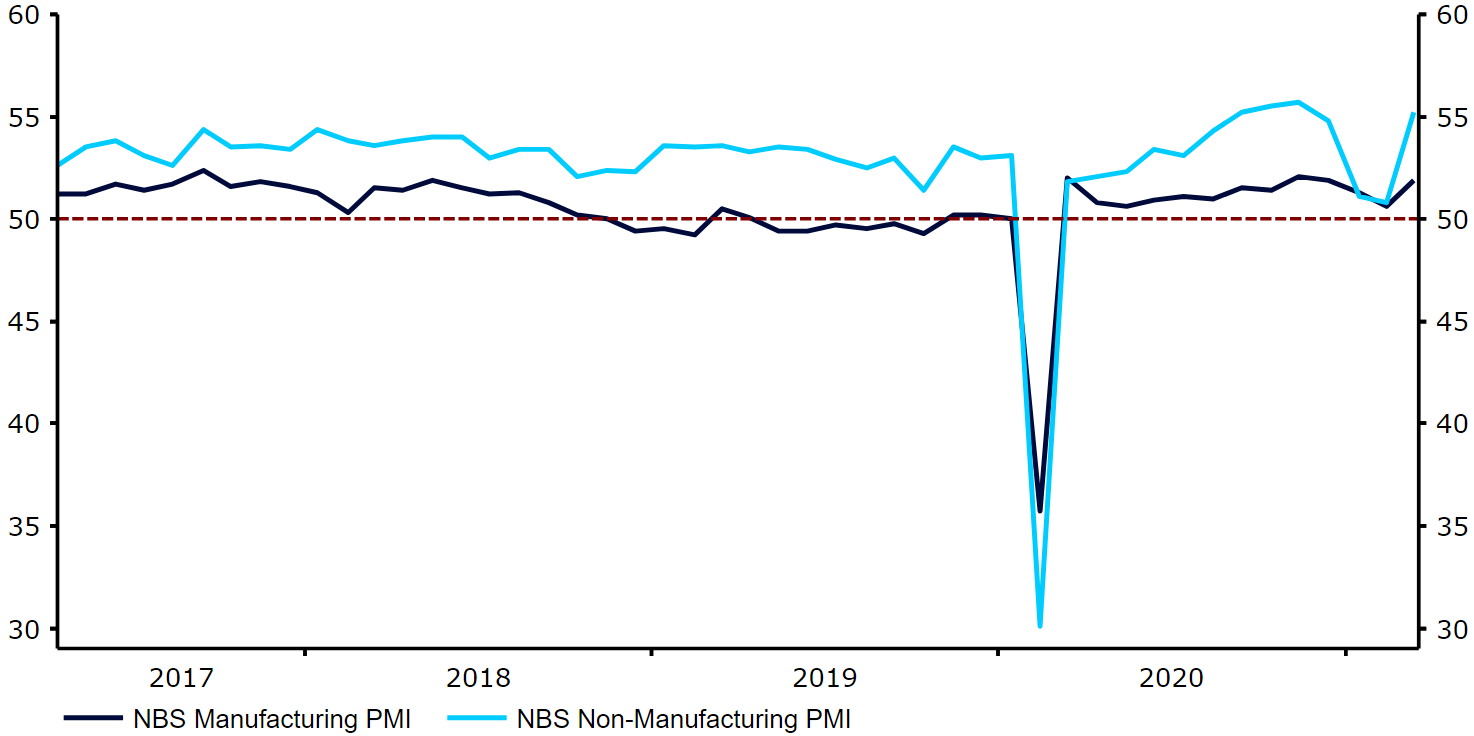
Source: Refinitiv Datastream Date: 27/04/2021
Another recent positive development for the yuan was the result of the 2020 US presidential election. Biden’s win has paved the way for greater fiscal support in the US, which investors are perceiving as a positive for the global economy. This is particularly important for the US’s major trading partners, of which China is the largest one. When it comes to its foreign and trade policy, the Biden administration is expected to be more predictable than Trump’s. While a quick resolution to the US-China trade war seems unlikely, we’re optimistic that the relationship between the two countries has a fair chance of improving and will most likely be better than under the Trump administration. It’s also worth noting that China’s relationship with the EU seems to be improving, with the two sides recently reaching an agreement in principle on an investment deal after years of negotiations.
In our view, the yuan is unlikely to receive too much of a boost from the rolling out of COVID-19 vaccinations in 2021, with an unwinding in restrictions set to narrow the gap in economic performance between China and most of the developed world. That being said, we remain bullish on the yuan over our forecast horizon and are continuing to pencil in gains for the currency versus the US dollar through to the end of 2022. China’s solid macroeconomic fundamentals should continue to provide support for the currency. China has a hefty hoard of reserves, equivalent to 19 months’ worth of import cover, maintains a current account surplus, and has low external debt of less than 15% of GDP. Moreover, we think that we are seeing a significant shift among investors whereby the yuan is now perceived as closer to a major currency than an emerging market one. We are seeing a progressive internationalisation of the yuan, whereby it continues to account for a growing share of the world’s trade and foreign exchange reserve assets, with CNY used increasingly for invoicing and payments. The latter still accounts for much less than China’s weight in global trade, suggesting room for growth and additional demand for the currency.
The lack of concern at the PBoC over a stronger currency also removes a potential stumbling block to yuan strength, particularly as China continues its efforts to diversify its economy away from exports. We are, therefore, continuing to forecast an appreciation of the yuan versus the dollar over our forecast horizon.
South African Rand (ZAR)
The South African rand has bounced back from the COVID-induced sell-off in early-2020 better than just about every other emerging market currency in the world.
Aside from the Brazilian real and Mexican peso, the rand was the worst performing EM currency that we cover in March and April of last year, shedding approximately 17% of its value against the US dollar during the two month period (Figure 15). Since then, we have seen an aggressive rally in the currency to its strongest position since January 2020.
Figure 15: USD/ZAR (April ‘20 – April ‘21)
Source: Refinitiv Datastream Date: 27/04/2021
The severity of the move lower in the rand at the onset of the COVID-19 crisis can be attributed to the high risk premium placed on the currency by investors. South Africa’s large fiscal gap, ballooning external debt, fragile growth outlook and political uncertainty ensure that this risk premium is larger than most of the currency’s peers. The rand was not only one of the worst performers during the initial ‘risk off’ period, but also the best performer during the period of improving appetite for risk among currency traders.
We think that the currency’s appeal from a carry trade perspective has helped the rand rise to the top of the EM FX performance tracker. During a period in which central banks have been slashing rates to record lows, near-zero in developed nations, South Africa has continued to offer relatively attractive real yields for foreign investors. Real interest rates in South Africa have actually remained positive throughout the pandemic and ever since February 2016, even following aggressive rate cuts from the SARB (Figure 16).
Figure 16: South Africa Real Interest Rate (2008 – 2021)
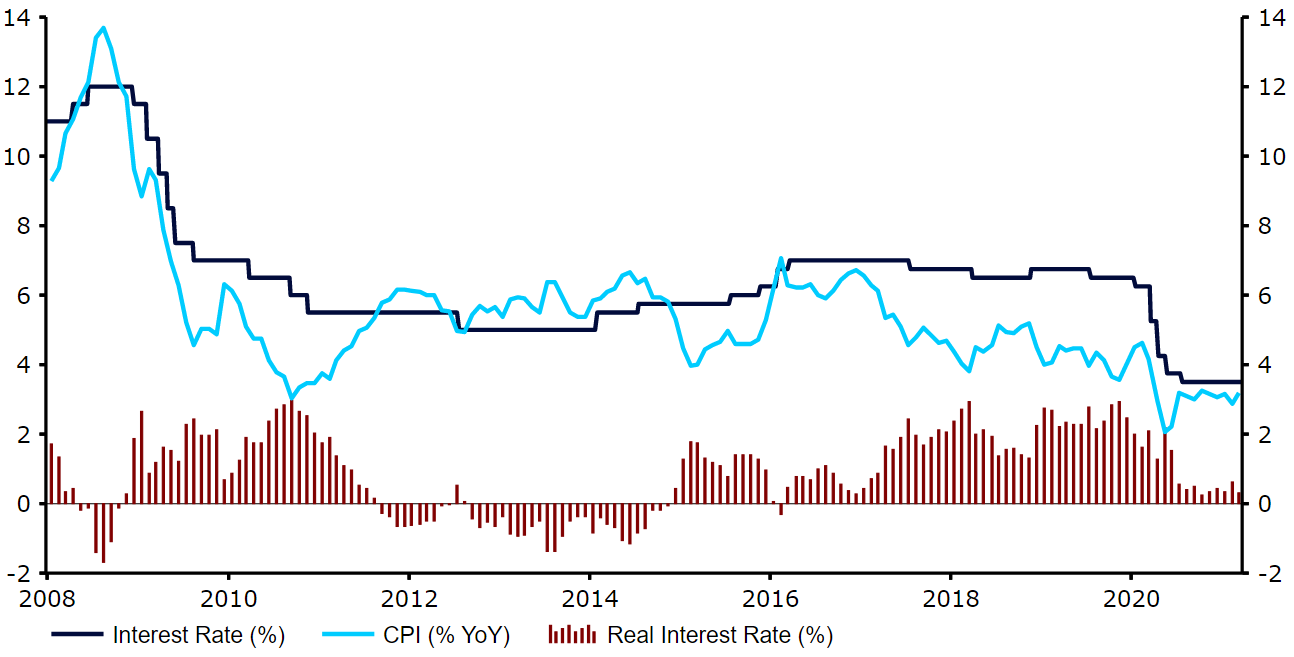
Source: Refinitiv Datastream Date: 27/04/2021
So far, investors have continued to favour the rand despite the emergence and aggressive spread of the B.1.351 variant of the COVID-19 virus first detected in South Africa in December 2020. While the Pfizer jab has proved effective against the mutation, a number of other vaccines have failed to provide adequate protection against this new version of the virus. There is no indication that the so-called ‘South African variant’ of the virus increases the chances of serious illness, although its higher contagion levels and greater resilience against vaccines are a cause for concern. This new variant triggered a surge in new virus caseloads during South Africa’s second wave of infection at the end of last year, although infection levels now appear to be largely under control following the reintroduction of tougher lockdown measures at the turn of the year.
Figure 17: South Africa New COVID-19 Cases (March ‘20 – April ‘21)
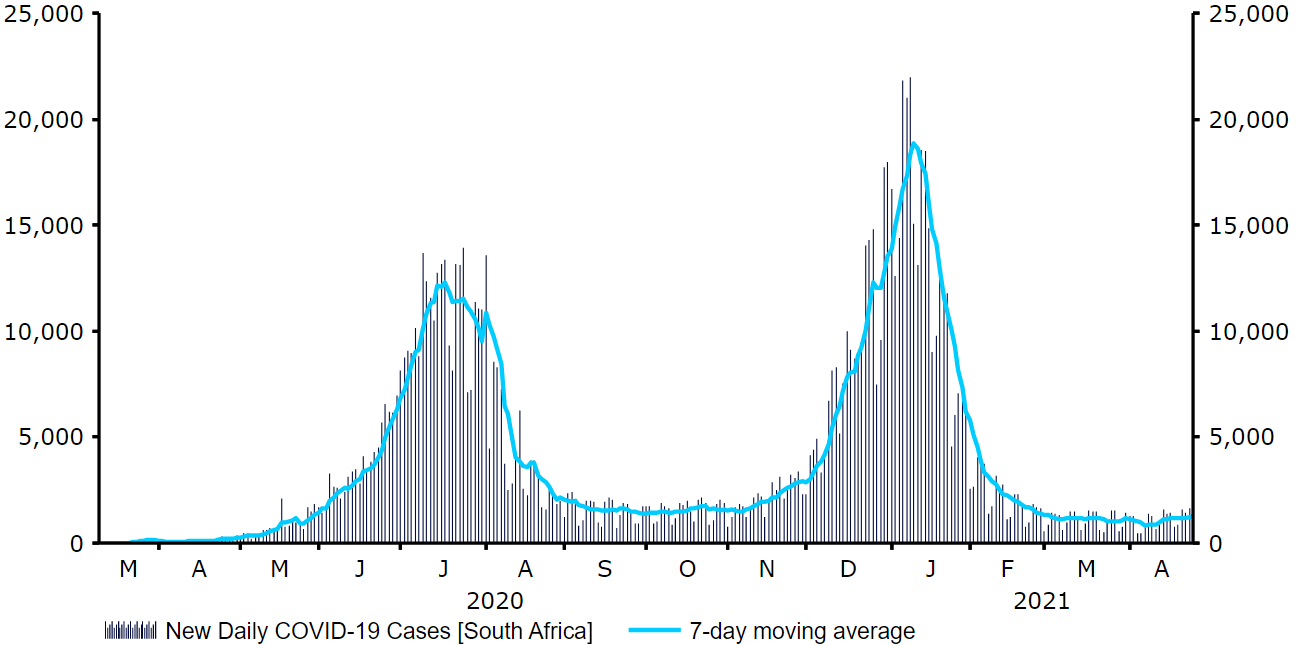
Source: Refinitiv Datastream Date: 27/04/2021
The rand’s recovery is remarkable given the collapse in economic activity suffered in South Africa in 2020. Activity fell by an astonishing 51.7% quarter-on-quarter in Q2 2020. While growth picked up sharply in the second half of the year, GDP still ended last year 7% smaller. Growth of approximately 3% is expected this year, although a number of downside risks to the outlook remain. The so far very slow vaccine rollout in the country undoubtedly presents one of the biggest risks, in our view. South Africa has so far administered less than 1 vaccine dose per 100 people, having only begun the vaccination programme in mid-February. The country has also been forced to sell its stock of AstraZeneca jabs due to its unacceptably low efficacy in dealing with the B.1.351 variant, instead focusing its efforts on rolling out the Johnson & Johnson and Pfizer jabs. The limited room to increase fiscal spending in South Africa also presents an issue. At almost 10% of the country’s GDP, the ANC’s fiscal stimulus package launched last year to combat the crisis is vast, although it increases the country’s already rising debt-to-GDP ratio.
Investors have also largely overlooked South Africa’s relatively weak fundamentals during the recent period of rand strength. We think that of all the BRICS countries, South Africa probably has the most fragile macroeconomic fundamentals, which we think will present a downside risk to the currency once the global pandemic situation is brought under control. The country has more foreign currency denominated debt than its peers as a percentage of GDP and a high overall debt-to-GDP ratio that is now around 80%. Foreign exchange reserves also remain comparatively low relative to its fellow BRICS currencies, albeit are now at rather more comfortable levels. Reserves currently equate to approximately 8 months’ worth of import cover, which are now sufficient levels, in our opinion. The SARB only tends to intervene in extreme cases and even during the peak of the current crisis appeared to allow the value of the rand to be determined purely by market forces. On a more positive note, South Africa’s current account balance is now in a much more healthy position, having moved into surplus last year for the first time since 2002 (2.2% of GDP).
Figure 18: South Africa Current Account Balance [as % of GDP] (2000 – 2020)
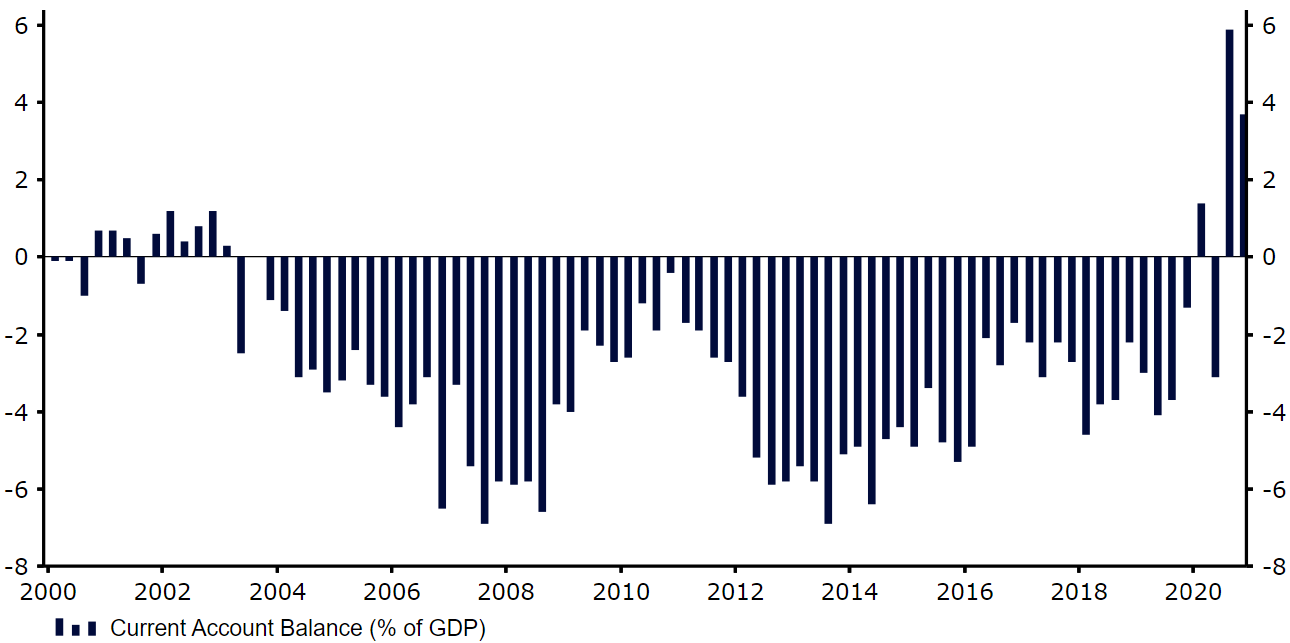
Source: Refinitiv Datastream Date: 27/04/2021
South Africa’s less favourable fundamentals, namely a high external deficit and increasing rate of debt accumulation, combined with the country’s so far slow vaccine rollout present downside risks to the rand. We do, however, still think that the currency’s appeal from a carry trade perspective means that it is relatively well placed to post modest gains versus the US dollar over our forecast horizon.
🎙 Listen to FX Talk podcast, your 20-minute financial update available on Spotify, Google Podcast, Apple Podcast or simply choose your favourite podcast app here.
SHARE

