Breakfast with the Bank of England: what’s been happening to productivity?
- Go back to blog home
- Latest
Clients and associates visiting Ebury’s London office on the 6th February were treated to a breakfast briefing with economist and the Bank of England’s agent for London, Rob Elder.
A major theme discussed was the bank’s latest assessment of the UK’s productivity. The bank has become more pessimistic about the trend in productivity and has revised down its forecast of GDP growth as a result.
Matthew Ryan, our Senior Market Analyst, takes a closer look.
Uncertainty surrounding Brexit and December’s general election were no doubt behind much of the slowdown, as was the ongoing trade spat between the US and China. Britain’s manufacturing sector was particularly hard hit, contracting by 1.1%, while the country’s dominant services industry grew by a meagre 0.1%. This ensured that the UK economy posted its joint worst year-on-year expansion since 2012 in Q4 2019.
Part of the weakness in the UK economy in the past few years can, however, also be attributed to the ongoing slump witnessed in Britain’s productivity growth. The lacklustre level of productivity growth in the UK, commonly measured as the level of output per hour worked, has been evident ever since the financial crisis in 2008/09 and has, as of yet, shown so signs of coming to an end.
We outline below four charts that we believe best highlight what has been dubbed as the UK’s ‘productivity crisis’.
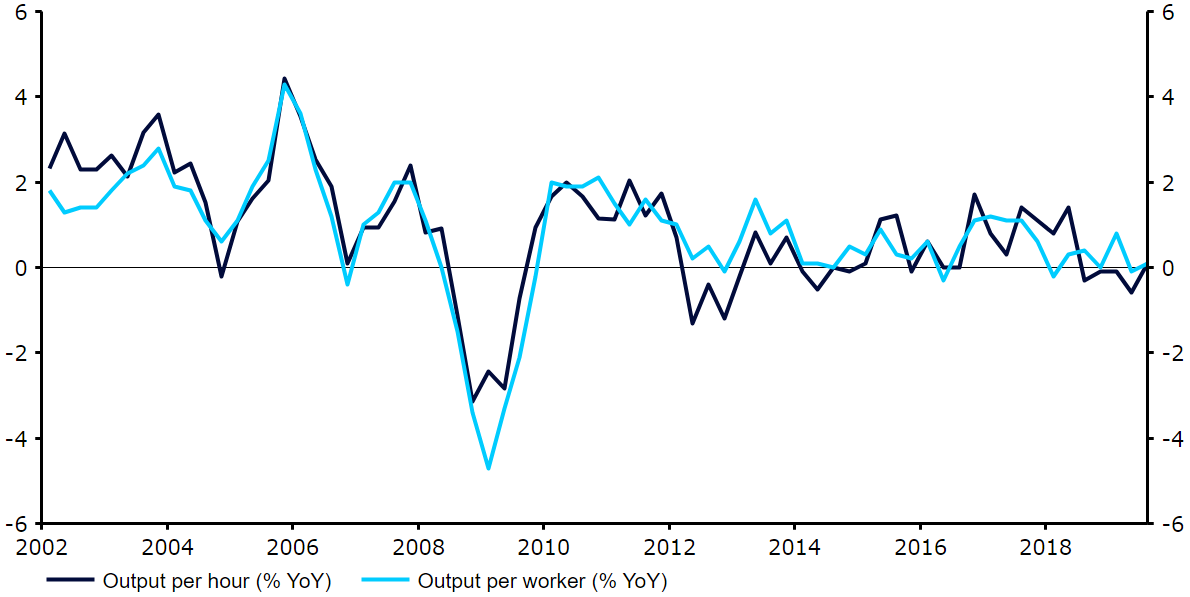
Figure 1: Output per worker & output per hour (2002 – 2020)

The traditional measures of output per worker and output per hour worked both remain very weak (0.1% year-on-year growth in Q3 2019). These are both expected to have fallen back below zero in the fourth quarter of last year, which would be a concerning development.
Figure 2: Output per hour [by sector] (2008 – 2019) [2008=100]

Breaking down total productivity by sector, we can see that the UK’s manufacturing industry has actually held up relatively well in that regard. The production sector on the whole, which also includes electricity & gas, water & waste and mining & quarrying output has, on the other hand, clearly not.
Figure 3: Total Labour Productivity vs. peers (1990 – 2020) [01/01/07=100]

As the above chart indicates, the UK is clearly not the only country to have suffered from a slowdown in productivity growth since the global crisis, although it has been one of the hardest hit. Using the beginning of 2007 as a base, UK productivity is now lagging behind both the US and the Euro Area although, as you can see, Japan now appears to be faring even worse.
Figure 4: UK Labour Productivity [vs. trend line] (1985 – 2020)

The upward trend witnessed in total UK productivity prior to the financial crisis had been pretty consistent since the data began in 1960. Since then, however, this upward trend has clearly flattened. Had the pre-crisis trend (between 1985 – 2007) continued, we estimate that productivity would be approximately 17-18% higher than it currently is.

